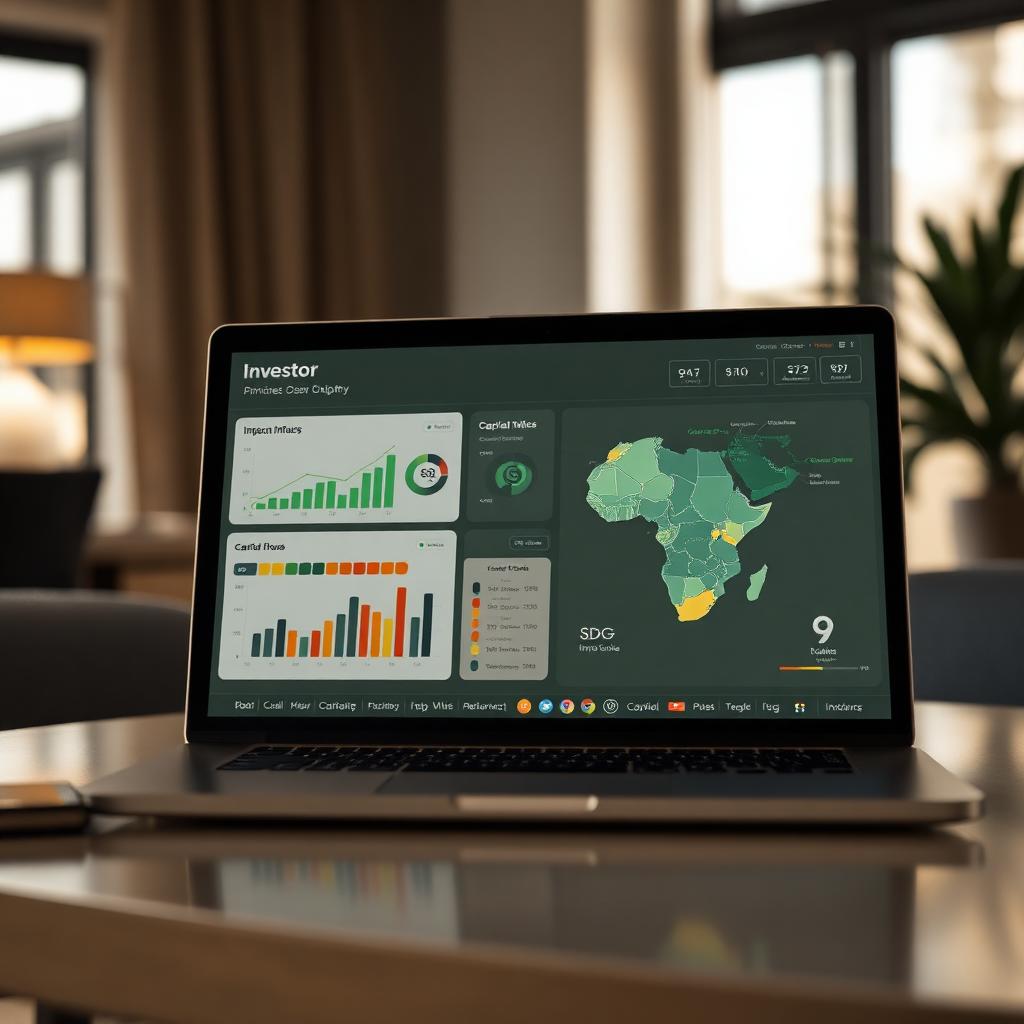
Investor Intelligence
Real-time, household-verified impact across the ecosystem · live data
For funders, partners and policymakers
Read the numbers behind every life lifted
Every metric on this page is household-verified through the Poverty Stoplight — no estimates, no inflated reach. Use it to track impact, due diligence, and SDG alignment.
- 1Scan the KPIsThe four tiles up top show livelihoods, communities, impact and revenue at a glance.
- 2Drill into regionsScroll to see growth by region and community. Spot where to deepen investment.
- 3Map to SDGsThe SDG panel shows progress against the UN Sustainable Development Goals — exportable for reports.
Tips
- •All figures update live as members move indicators from red to green.
- •Talk to the team about a custom data room for your fund or family office.
+12.4% MoM
1,098,000
Livelihoods created
+0 live
1,020
Communities activated
household verified
0
Avg impact score
ARR
R102M
Revenue (ZAR)
Government & Institutional JV Track
Co-invest in food-security infrastructure
Hub establishment USD 250–750k · breakeven 18–36 months · 18–28% gross margin at scale. 4-phase rollout to a pan-African network under AfCFTA.
Livelihoods & farmers
Cumulative onboarding · 8 mo
LivelihoodsFarmers
SDG progress
Composite, weighted by region
- SDG 1 — No Poverty38%
- SDG 2 — Zero Hunger52%
- SDG 4 — Education44%
- SDG 5 — Gender Equality61%
- SDG 8 — Decent Work47%
- SDG 13 — Climate33%
Top regions
Regional heatmap
Low impactHigh impact